


Express Yourself: Creating an Infographic
Overview
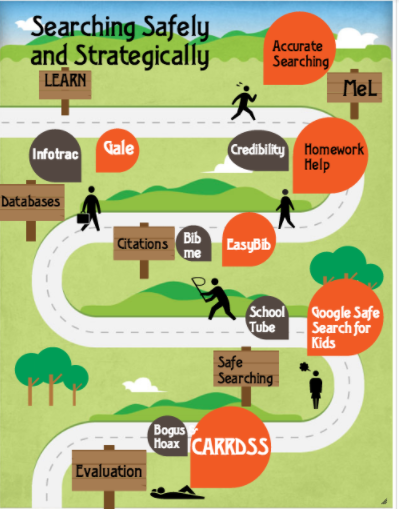
Infographics are graphic visual representations of information, data or knowledge intended to present information quickly and clearly. They are fun to create and students will be engaged in the creative process of presenting their information in an interactive visual form.
Students will do research on a topic, after which they will present their findings in a creative, visual manner. Utilizing information from a variety of resources, students will create an original infographic.
Learning Objectives
Students will:
- Be able to create an infographic containing key details regarding a given topic.
Vocabulary
Vocabulary Words:
-
Infographic: An infographic is a visual image such as a chart or diagram used to represent information or data.
Pre-planning
To prepare for this lesson:
-
Choose a topic for students to use for their infographic.
-
Locate information for the students or bookmark the best places for them to do their research.
-
The teacher will familiarize him/herself with infographics and their creation.
-
Read this article on how to present information visually with an infographic. There are helpful tips on color, font, icons, text and images
-
Ensure all students have access to the infographic creation tool of your choice.
Accommodations
See Accommodations Page and Charts on the 21things4students.net site in the Teacher Resources.
Steps
Directions for this activity:
- Pick a topic for students that will lend itself well for the students to visually present using an infographic. You may want them to compare/contrast, create a timeline or provide information to teach the topic to others.
- Introduce the topic that your students will be working on.
- Have the students do their own research after the teacher lecture.
- Share examples of infographics with students as models for their creation.
- Show students how to create their infographic.
- Give them tips on how to use color, font, images so that they do a nice job visually presenting their information.
- Students then create an infographic using an infographic creation website.
Assessment Options
Different options for assessing the students:
- Observations
- Check for understanding
- The teacher will informally observe students during the research and creation process to ensure they are able to:
- create an infographic with relevant data and pictures to present their research.
- be able to share their infographic with the teacher and classmates.
- The teacher will informally assess understanding during the whole-group debrief.
MITECS COMPETENCIES & ISTE STANDARDS
MITECS: Michigan adopted the "ISTE Standards for Students" called MITECS (Michigan Integrated Technology Competencies for Students) in 2018.
Creative Communicator
6c. Students will create original works or responsibly repurpose or remix digital resources into new creations.
Devices and Resources
Device: PC, Chromebook, Mac, iPad
Browser: Chrome, Safari, Firefox, Edge, ALL
App, Extension, or Add-on:
Piktochart
Websites:
Canva
CONTENT AREA RESOURCES
ELA
-
W.5.2: Write informative texts to examine a topic and convey ideas and information clearly.
-
W.5.6: With some guidance and support from adults, use technology, including the Internet, to produce and publish writing as well as to interact and collaborate with others.
Integrated Arts
Students could design their own graphics using Google Drawings and include those within their infographic.
Math
Infographics can be used in math to show statistics, graphs, and charts for a given concept.
Science
Infographics can be used to express students learning in a variety of science concepts.
Social Studies
- U2.1.1: Describe significant developments in the Southern colonies, includingpatterns of settlement and control including the impact of geography (landforms and climate) on settlement (G)
- development of one-crop economies (plantation land use and growing season for rice in Carolinas and tobacco in Virginia) (G, E) •relationships with American Indians (e.g., Powhatan)
- development of colonial representative assemblies (House of Burgesses) (C)
- U2.1.2 : Describe significant developments in the New England colonies, including patterns of settlement and control including the impact of geography (landforms and climate) on settlement (G)
- relations with American Indians (e.g., Pequot/King Phillip’s War)
- growth of agricultural (small farms) and non-agricultural (shipping, manufacturing) economies (G, E)
- the development of government including establishment of town meetings, development of colonial legislatures and growth of royal government (C)
- religious tensions in Massachusetts that led to the establishment of other colonies in New England (C, E)
- U2.1.3: Describe significant developments in the Middle Colonies, including patterns of settlement and control including the impact of geography (landforms and climate) on settlement (G)
- the growth of Middle Colonies’ economies (E)
- The Dutch settlements in New Netherlands, Quaker settlement in Pennsylvania, and subsequent English takeover of the Middle Colonies
- immigration patterns leading to ethnic diversity in the Middle Colonies (G, C, E)
Credits
This task card was created by Jean Smith, Van Buren Public Schools, January 2018.